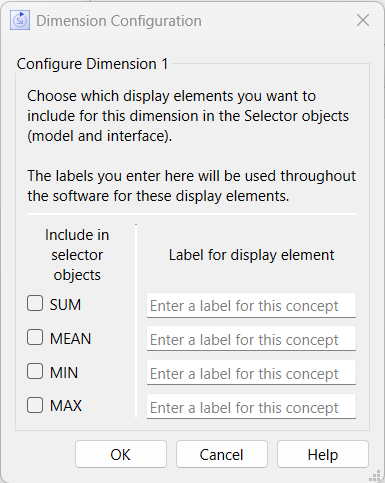
Use the Dimension Configuration dialog box to specify which output array operations will be made available when using the Selector object and the Results Panel. Any labels specified will also be used in the legends of graphs and tables.
To open the Dimension Configuration dialog box, click on ![]() for a dimension in the Array Editor dialog box.
for a dimension in the Array Editor dialog box.

Use this to specify which array operations you would like to be available when using the Selector object and in the Results Panel. The SUM operation will always be listed first (before any elements of the dimension) and the others after the elements.
SUM - sums across array elements.
MEAN - averages across array elements.
MIN - finds the minimum value of the array elements.
MAX - find the maximum value of the array elements.
Check the operations you wish to include.
Is the label that will show for the operation. For example, you could use Total for the SUM operation. For an array with 2 elements the selector would then look like:

In addition, in any graph, table, or other output object that label would be displayed

If you do not specify a label, then SUM, MEAN, MIN, MAX will be used (these names are the same as the respective Array builtins since they perform the same operation).
Independent of your selection of elements or labels all operations will be available for tables and graphs using the default names. It is only the array selector (and result panel) that change content only if the operations are selected.
To accept the changes and apply them to the dimension being edited.
To abandon changes.
To open this topic.